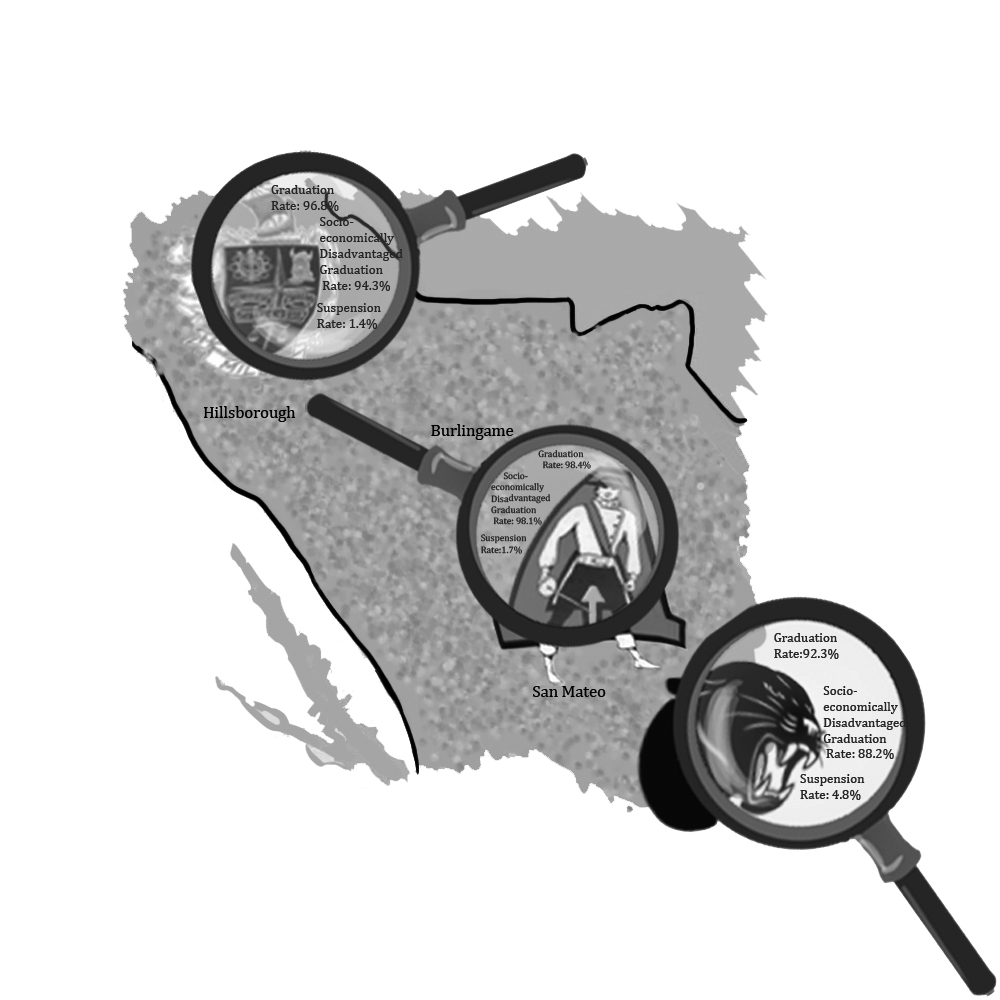
California’s new accountability program aims to offer a more in-depth report on the academic performance and socioeconomic demographics of individual schools. Before, schools were ranked solely based on the Academic Performance Index, which only measured students’ performance on standardized tests. Therefore, the State Board of Education approved an Accountability and Improvement System that offers the public more information on the progress of a school or district.
This new system will show data on the school’s atmosphere and students, ranking each category by performance levels indicators. Currently, as reported on Aragon’s dashboard, the school’s suspension rate stands at 1.7 percent of the student population, and the graduation rate is 98.4 percent. Additionally, the dashboard provides information on college readiness based on standardized testing. The results for those indicators will be released in the fall this year after 2017 CAASPP test scores are reported.
The California Board of Education intends to improve the schools in order to enrich their students. In the article from KQED’s “Beyond Test Scores: State Debuts Detailed Online School Reports for Parents,” VP of Education with the California State PTA, Celia Jaffe says, “The purpose is to improve schools, not for ranking or punishing.”
Instructional aide Jonathan Martinez says, “Education wise, I don’t see it changing much of our district. That board does not show me how the teachers need start to touch on other certain areas.” He also says, “Parents will definitely look at that dashboard, and see things like suspension rates, or graduation rates and say that’s where they want their kid to go.”
The dashboard helps parents understand schools on a deeper level, and use it to find out which school is the right one for their children. Aragon parent Bhargavi Yadalla says, “Schools should not only be based on how well students perform, but also by how their environment is and how the kids are doing in school, outside the classroom.”
Currently, Aragon’s dashboard reports a ninety eight percent graduation rate, a five percent english learning population, and a seventeen percent socially disadvantaged rate. Further divisions of each category, ranging from suspension rates to graduation rates are divided by ethnicity.
As the dashboard divides the groups into multiple ethnicities, sophomore Jasslie Altamirano says, “I feel like it’s not right but I understand why they’re doing it [dividing between ethnicities]. But it doesn’t honestly matter what is the ethnicity you are. If they’re trying to divide [data,] I feel like it shouldn’t be open. The public can use the number of people of a specific ethnicity to find out where parents should place their child.” She also adds, “Students will feel more pressure to live in a standard, and because it’s so open, anybody can see it, and it brings more pressure to the school, and towards the education board.”
While the new accountability program raises potential uncertainty including racial categorization, it seeks to provide the public with a more detailed and accurate representation of the state’s schools and environments.


